Spectrograph: A Brief Introduction of Radiospectrogram Analysis
The five basic radiospectral event Types are quite distinct, but that does not mean they are always easy to identify, especially when several occur nearly simultaneously. This brief guide illustrates some of the great variety of radiospectrograms and introduces some of the factors to consider when analysing them.
Rather than examine each event Type in numerical order, this discussion treats each event Type in the order in which they are most likely to be encountered (i.e. from most to least common).
Type III Events
Type III bursts can occur singularly, in groups, intermittently over an extended period and continuously in the form of a storm. Often a Type III has a fundamental and a harmonic component (just as most Type IIs do). Since the Type III has such a fast drift rate, the two components usually merge, so it is not usual to record the components of a Type III separately.
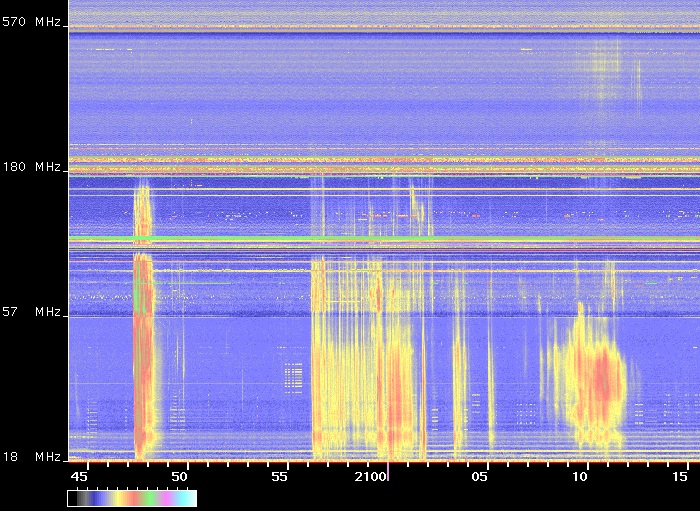
Figure 1: Singles and groups of Type III bursts.
Figure 1 provides several Type III examples that display some common tendencies. Strong Type III bursts are usually broader than weak ones. Individual Type IIIs tend to be more intense at the lower end of their frequency range. Strong groups of Type IIIs sometimes have an underlying continuum emission (as does the group in the lower right of the figure). Also worth noting is that some of the Type IIIs in the top right of the figure do not extend down to low frequencies.
Examples of Type III storms are shown in Figures 2 & 3. In both cases they are concurrent with Type I storms (see below). This combination is quite common and can make it difficult to determine the upper frequency of the Type III storm. These examples are typical - there are several Type III bursts per minute, individual bursts vary in intensity but most span the same frequency range and there is an associated underlying continuum (this sometimes extends beyond the frequency range of the Type III bursts).
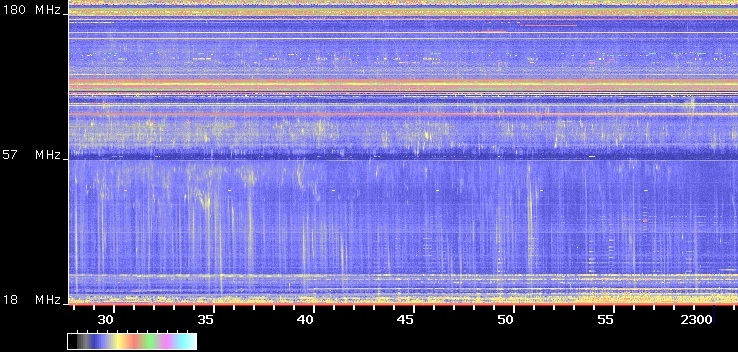
Figure 2: Concurrent Type III and Type I storms with similar intensities.
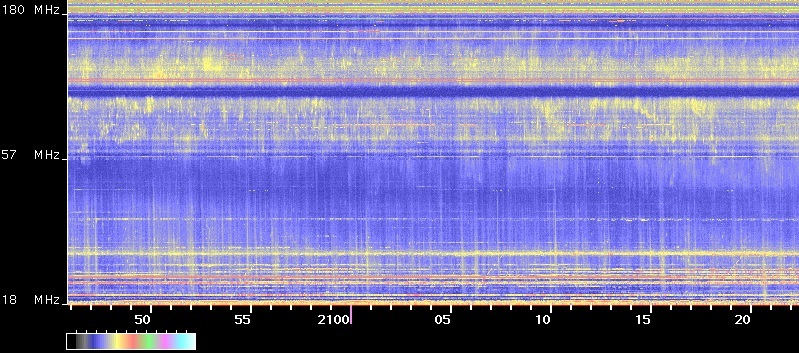
Figure 3: Concurrent Type III and Type I storms with Type I dominating.
Very rarely, a Type III burst reaches its lowest frequency and then turns up (in a hockey stick shape). Also very rare is a Type III burst that appears to drift from low to high frequencies (reverse drift).
When Type IIIs occur in storms or large groups, or are of strong intensity, they can make it difficult to interprete other features in a spectrogram. Further examples of Type IIIs demonstrating some of these points appear in later sections.
Type I Events
Type I bursts only occur in storms. These storms consist of thousands of short duration and narrow bandwidth bursts. Two examples appear in Figures 2 & 3. Like Type III storms, Type I storms are often accompanied by an underlying continuum. In stronger storms drifting chains of individual Type I bursts are often observed (e.g. Figure 3 around 2110 and 2115). Care must be taken not to mistake these for Type II bursts (discussed below).
The Type I storm in Figure 4 also contains drifting chains. This example is more unusual because there is no underlying continuum and the bottom frequency is quite low (~30 MHz).
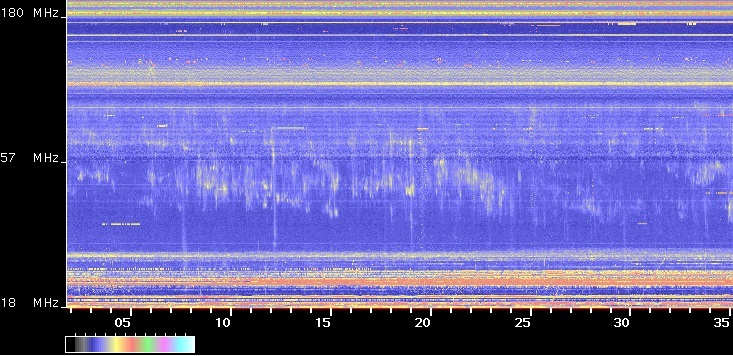
Figure 4: Type I storms without continuum.
Type V Events
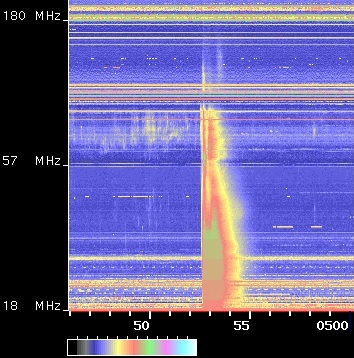
Figure 5: A strong Type V.
Type V events are always preceded by one or more Type III bursts of at least moderate intensity. Figure 5 is an example. This spectrogram is typical in that the Type V begins at the same time as the Type III and tends to persist longer at mid to low frequencies. Also typical is the less protracted duration at the lowest observable frequencies.
Type V bursts can be quite intense and occasionally contain some structure. An example is presented in Figure 9. Here it is somewhat unclear whether or not the Type V partially conceals a Type II.
Rarely, Type V bursts are delayed, not commencing until 1-2 minutes after the associated Type III.
Type II Events
There can be enormous variation in the appearance of Type II radio bursts. A straightforward example appears in Figure 6 (starting at about the 40 minute tick mark). A fundamental/ harmonic structure is quite distinct. This structure is typical, appearing in a large majority of Type II bursts. When this structure is present, the harmonic is almost always stronger than the fundamental.
In this example the Type II is preceded by a significant group of Type IIIs. Such 'precursor' Type IIIs are quite common. They can lead the Type II by up to 10 minutes, but 2-3 minutes is a more typical delay.
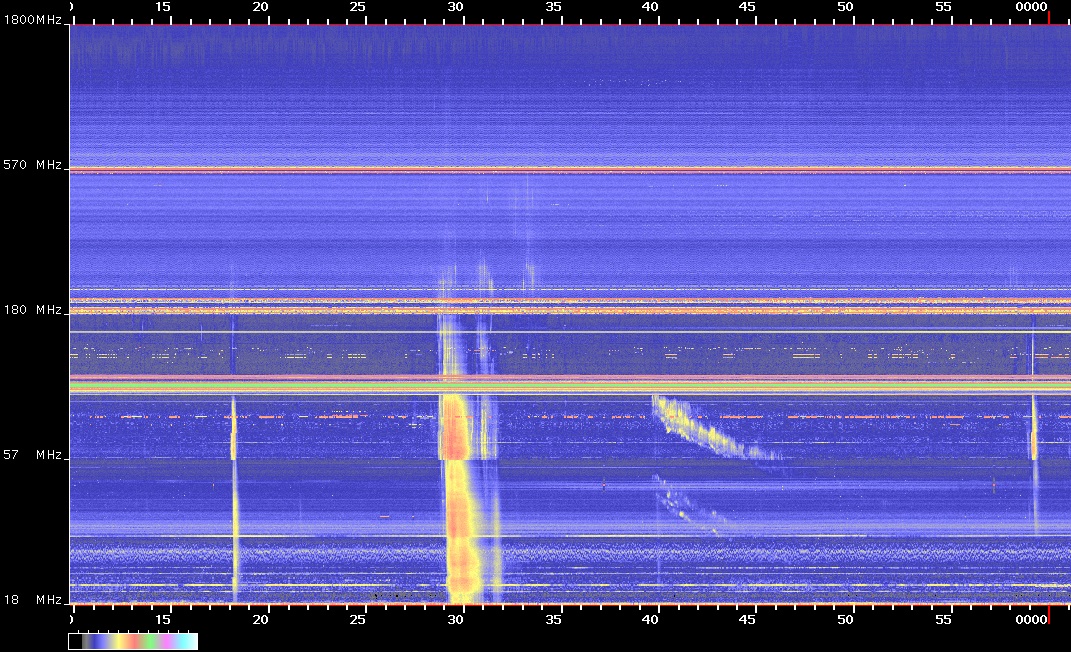
Figure 6: Simple Type II preceded by Type III bursts.
Preceding Type IIIs are not always the case however and Figure 7 presents a counter-example. In this particular case the form of the Type II is less distinct. [Other features of this spectrogram include elevated background noise and a repeating sweeping, ionosphere sounding signal at low frequencies.]
In these two examples (Figures 6 & 7) both Type II bursts last for about 8 minutes. Typically, Type II bursts last 5-10 minutes, but have been known to exceed 30 minutes. Long bursts are usually very well defined and easy to identify. It is often much more difficult to interpret short duration Type II bursts. Anything under 3 minutes duration (especially if coincident with other radiospectral activity) is open to debate - even amongst experienced observers. Nevertheless, it is occasionally possible to identify a Type II burst as short as one minute unambiguously.
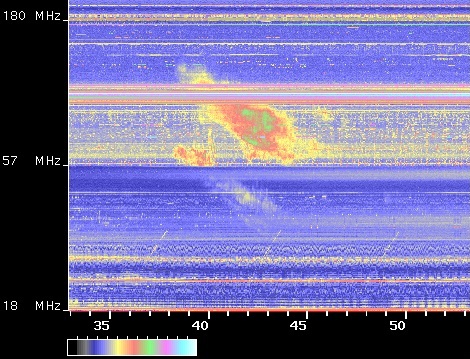
Figure 7: Solitary Type II.
Two more Type IIs are depicted in Figure 8. Again these are straightforward to identify (despite the background noise from an electrical storm). In addition to the fundamental/ harmonic structure, these events clearly exhibit band-splitting. This is where the components of a Type II (fundamental and/or harmonic) are themselves split into two or more roughly parallel bands. Once again the Type IIs are preceded by Type III activity.
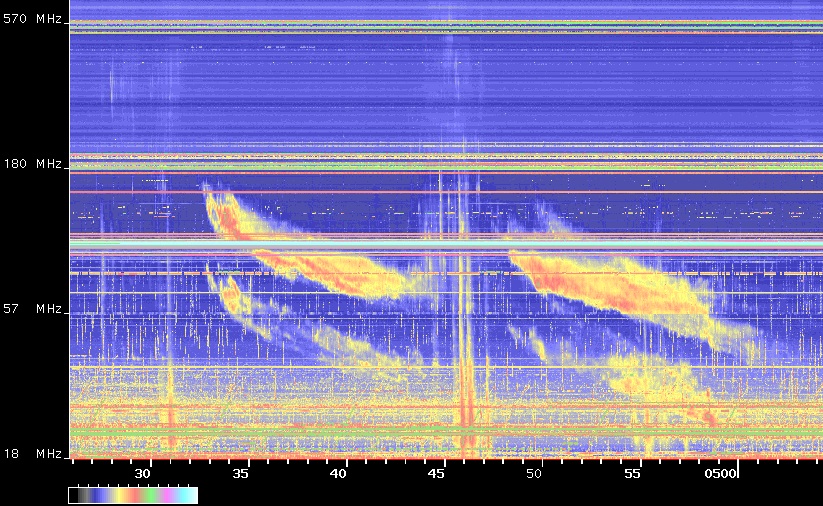
Figure 8: Two Type II bursts with background noise.
Figure 9 also presents a clearly discernible Type II (starting at the 45 minute tick mark).
This event has split bands as well as a fundamental/harmonic structure. The starting frequency of this event is unusually high. Typically the fundamental component of a Type II starts below 150 MHz (usually below 100 MHz). At the 50 minute tick mark, this burst changes slope and the band-splitting widens. This could be interpreted as a second Type II following on the end of the first, however this is unlikely (the end of one Type II rarely matches up so neatly with the start of a second) and it was reported as a single event.
As noted in the previous section, Figure 9 contains a second Type II partially imbedded in a Type V. The strength of the Type V makes it difficult to identify the exact start time of the Type II, but it seems to be close to the 43 minute tick mark. There is no obvious fundamental/harmonic structure in this burst. This maybe because the structure is lost in the stronger Type III/V complex, or simply because the is no such structure to observe.
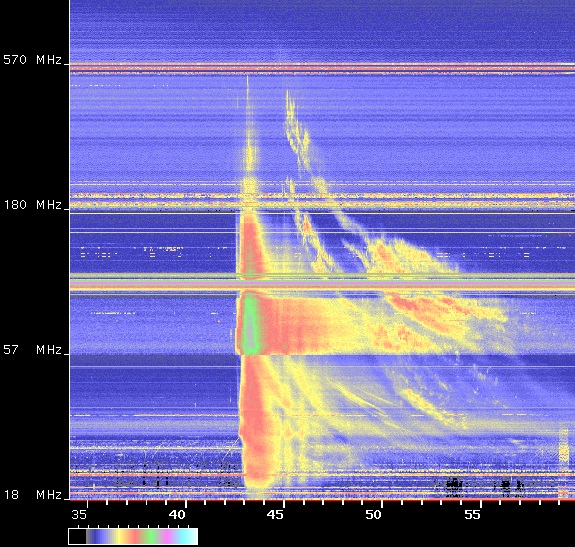
Figure 9: Type III with Type V and one (or two) Type II bursts.
Another example of a Type II without any fundamental/harmonic structure appears in Figure 10. This rather faint event varies in intensity over its length. Careful inspection of the spectrogram suggests the burst starts at 0042 (at ~160 MHz) and extends to 0055 (at ~20 MHz).
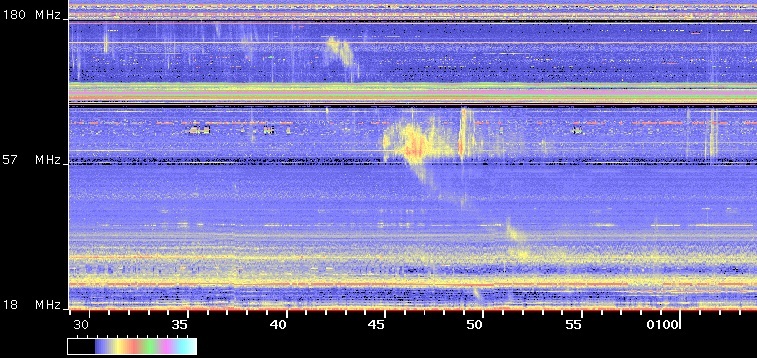
Figure 10: Type II without a fundamental/harmonic structure.
The Type II depicted in Figure 11 exhibits a herring-bone structure. This is an uncommon form where the "spine" of the Type II is straddled with Type III bursts over much of its length. There is some debate among researchers as to the significance of this structure - is it a Type II variant or simply a Type III group that coincides with a Type II burst? There is no distinct fundamental/ harmonic structure in this example, however there are some hints of a fundamental component in the low frequency noise (e.g. at 0553 and 0601). [Sometimes the absence of a fundamental/ harmonic structure simply results from the fundamental component being below the instrument's lowest operating frequency.]
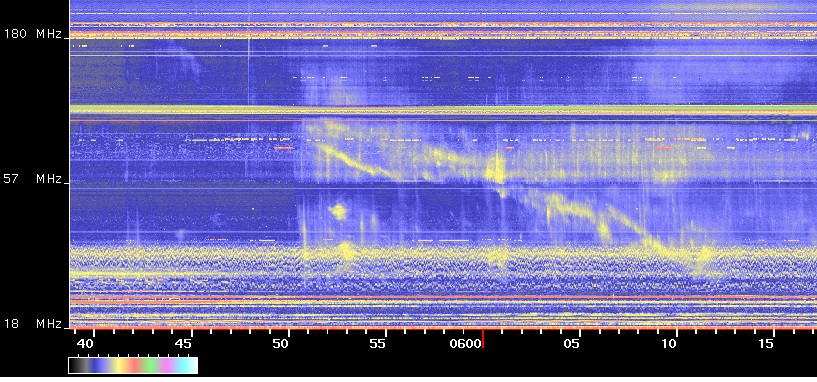
Figure 11: Type II with herring-bone structure.
The remaining example Type II bursts are all part of complex spectrograms containing multiple event Types. These will be discussed in the Complex Events section.
Type IV Events
Like Type II bursts, Type IV continua can exhibit a wide range of forms. By definition they are broadband, but while some may be 500 MHz wide, others may exceed two or three times that. They may be quite uniform in intensity, or they may fluctuate and exhibit complex internal structure. Some Type IV continua start with a certain bandwidth, spread wider as they gain intensity, then narrow again as they fade. Others commence at their maximum bandwidth and their upper frequency drifts downwards over time.
Figure 12 depicts a portion of a Type IV that spans the 200-1000 MHz range. Clearly this continuum broadens and intensifies over time. It is also possible to identify some internal structure, particularly at higher frequencies.
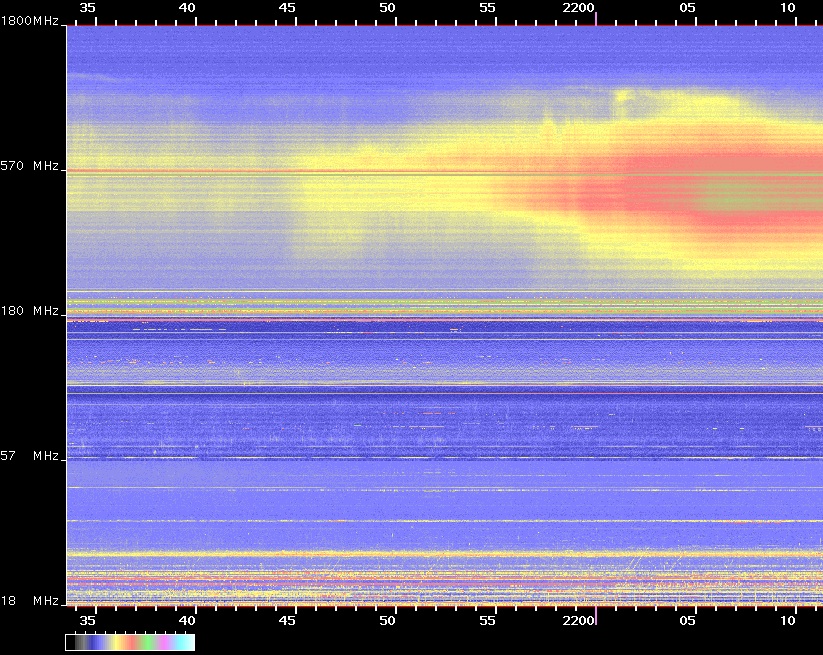
Figure 12: Type IV continuum.
Occasionally a lone IV will be observed, but the great majority of Type IV continua are preceded by other events. Usually this will be a group of Type IIIs and a Type II, but it can be one or the other.
Examples of Type IVs coincident with other event Types are presented in the following section.
Complex Events
It is common for several different event Types to occur at approximately the same time. The result is often a crowded looking spectrogram that can be difficult to interpret. This section contains several examples of these more complex spectrograms.
Most Type IVs follow moderate or stronger Type II bursts, often accompanied by Type III groups as well. Such an example is presented in Figure 13.
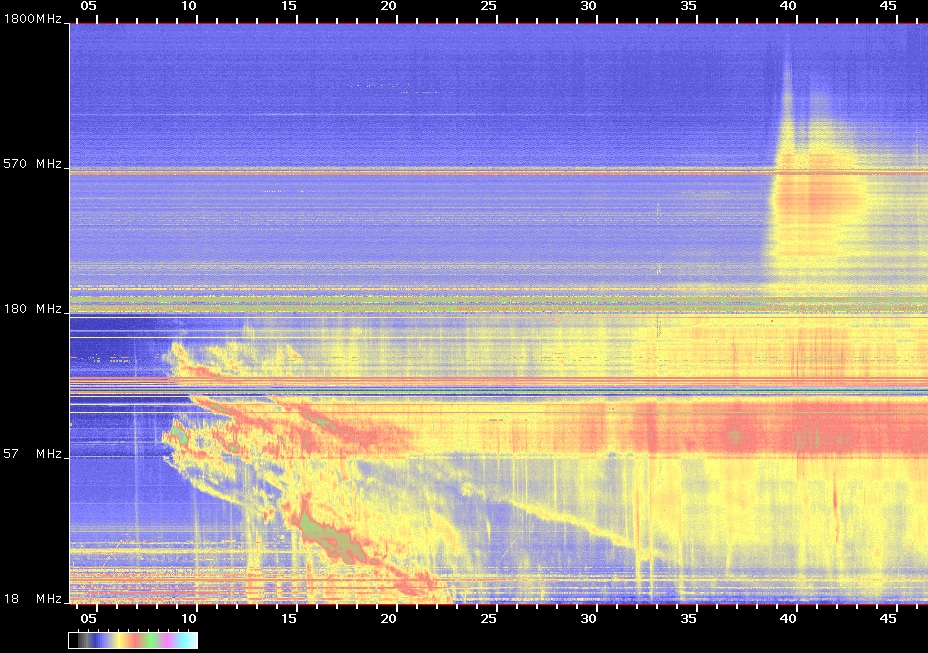
Figure 13: Long duration Type II with accompanying Type IV continuum.
After some weak initial Type III bursts a strong Type II begins, followed by a Type III storm (with underlying continuum). Since the initial Type IIIs are weak, the starting time and frequency of the Type II are unobscured. The Type II is well defined, having a fundamental/harmonic structure and split bands. Unusually, the most intense part of the Type II is in the fundamental (between the 15 & 19 minute tick marks). The fundamental drifts down to the instrument's lower frequency limit over some 15 minutes, but the harmonic is visible for half an hour.
There is also a Type IV continuum in this spectrogram. It is clearest following the group of high frequency Type III bursts between tick marks 39 & 43. Closer inspection revels some weak continuum (in the upper half of the spectrogram) after the 34 minute tick mark. The difficulty in interpretation here is in trying to determine how far the Type IV extends into the lower half of the spectrogram (where is merges with the continuum associated with the Type III storm).
In contrast to the previous example, the continuum in Figure 14 is easily identified. It is the Type II that is difficult to isolate here.
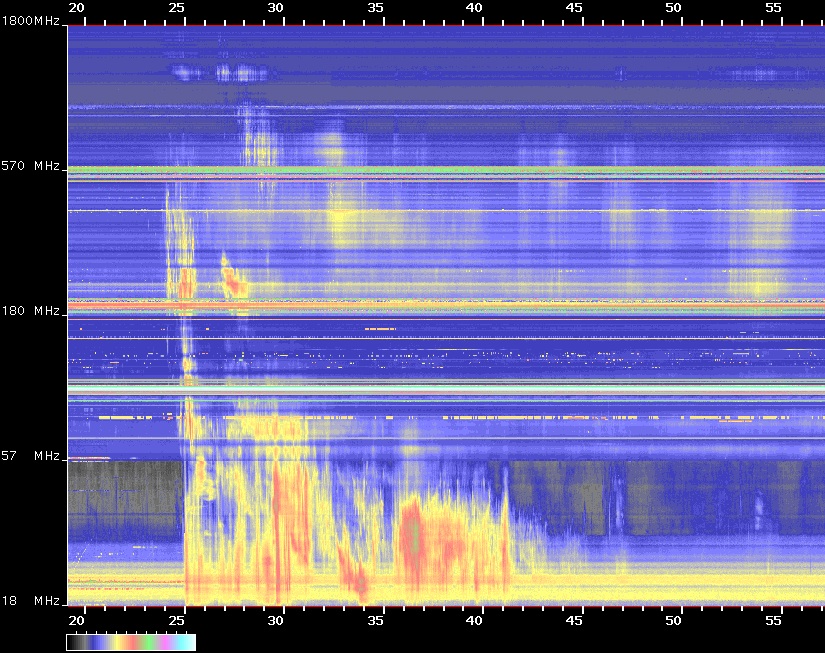
Figure 14: Type II embedded in Type III bursts with accompanying Type IV continuum.
The Type IV in this example is not very strong but still clearly varies in intensity over time. It begins concurrently with the initial Type III group.
The Type II in this spectrogram (between the 27 & 34 minute tick marks) is difficult to see because it is coincident with Type III bursts of equal and stronger intensity. There is a fundamental/harmonic structure but it is well hidden. Fortunately, the start of the harmonic component is at a high frequency (~300 MHz). This puts it above the Type IIIs, making it easier to identify.
The fact that most Type II bursts have a fundamental/harmonic structure greatly assists in their interpretation in situations like this. The fundamental and harmonic components usually closely mirror each other, so that a feature visible in one should be visible in the other at the same time (and of course one is at double the frequency of the other). This is particularly true for strong Type II bursts. For weaker bursts, sections of the components can be too faint to clearly identify. If this is the case any coincident Type IIIs or continuum could mask the Type II entirely.
A final example is presented in Figure 15. Here a Type III storm with underlying continuum is in progress across the entire spectrogram. Stronger Type III groups overlie the storm in places (such as between tick marks 10 & 11). This example demonstrates once again that determining the exact timing and frequency range of events overlying one another is open to interpretation.
There is a Type II here with a fundamental/harmonic structure. It is not immediately obvious because the components are narrow with no band-splitting, and drift is quite fast. The Type II is between the 13 & 17 minute tick marks. The start of both components is in the relatively strong background continuum to the Type III storm. Both components then fade for a minute and a half, and then strengthen before ending. This is a case where several factors conspire to make Type II identification difficult.
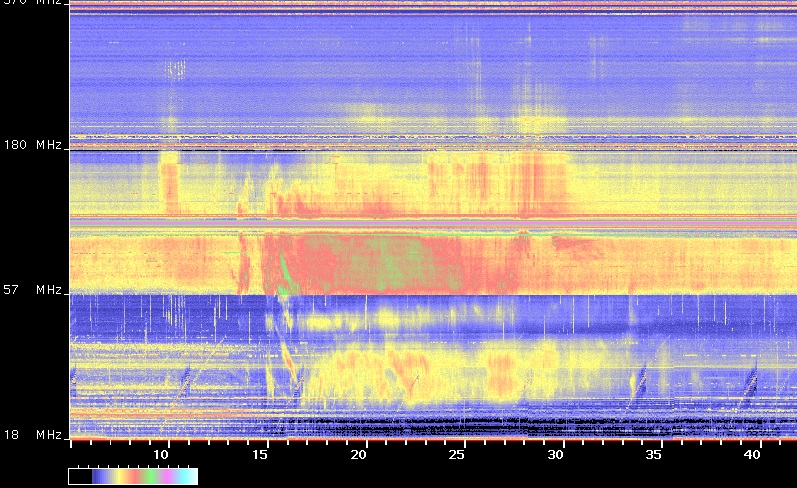
Figure 15: Type II and Type IV embedded in an ongoing Type III storm with continuum.
There is also a Type IV in this example which begins during the Type II burst. It is initially quite strong, but starts to fade after some 10-15 minutes. It persists at this, less intense, level past the end of the spectrogram.
One last feature of note in this spectrogram is the absence of signal at low frequencies from about the 15 minute tick mark onwards. This is a short wave fadeout - a direct indication of the terrestrial effects of these solar bursts.


