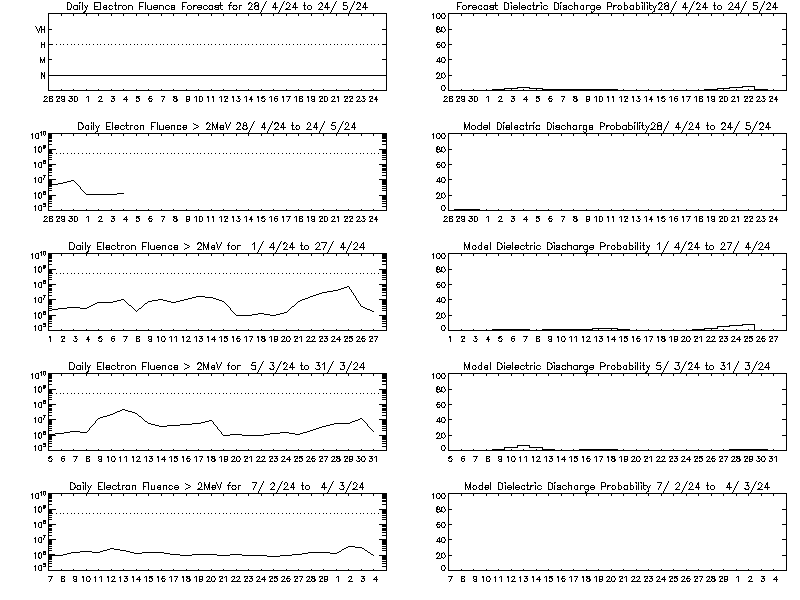
Electron Fluence Forecast
Units on graphs are electron flux accumulated over 24 hours per square centimeter per steradian per day.
The following marks are shown on the graphs:
| Mark | Meaning | Electron Flux |
|---|---|---|
| N | Normal Background Fluence | Less than 10e8 |
| M | Moderate Fluence | Greater than 10e8, less than 5x10e8 |
| H | High Fluence | Greater than 5x10e8, less than 10e9 |
| VF | Very High Fluence | Greater than 10e9 |
Updates: Every 24 hours

See also a description of the model used to produce the above probabilities.


