


Global Overview
Click on images to view full sized version.

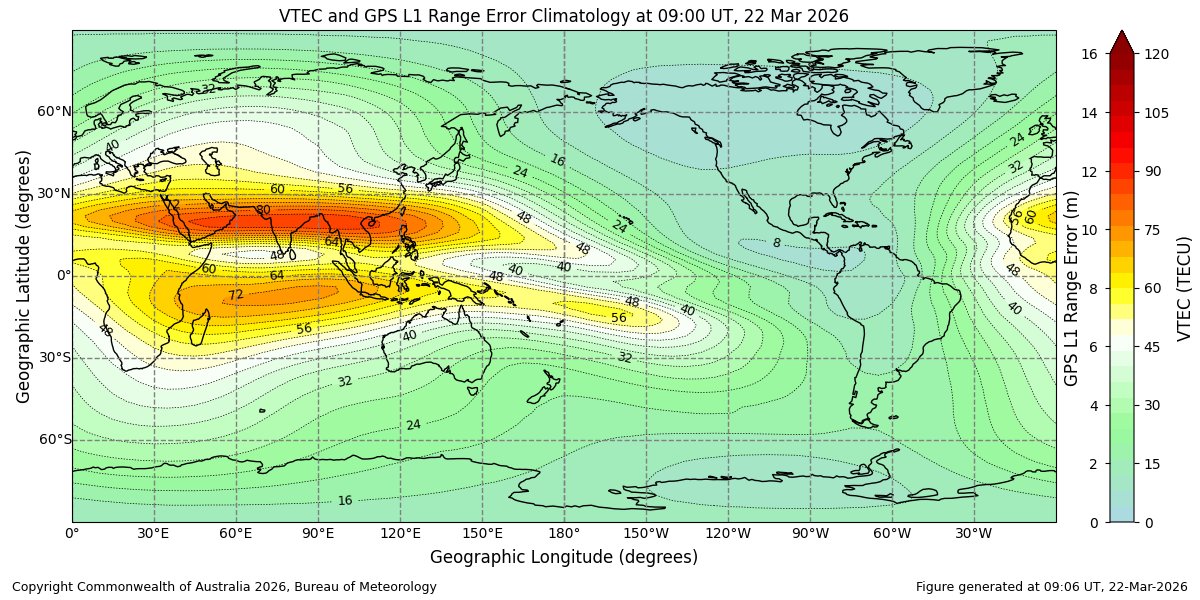
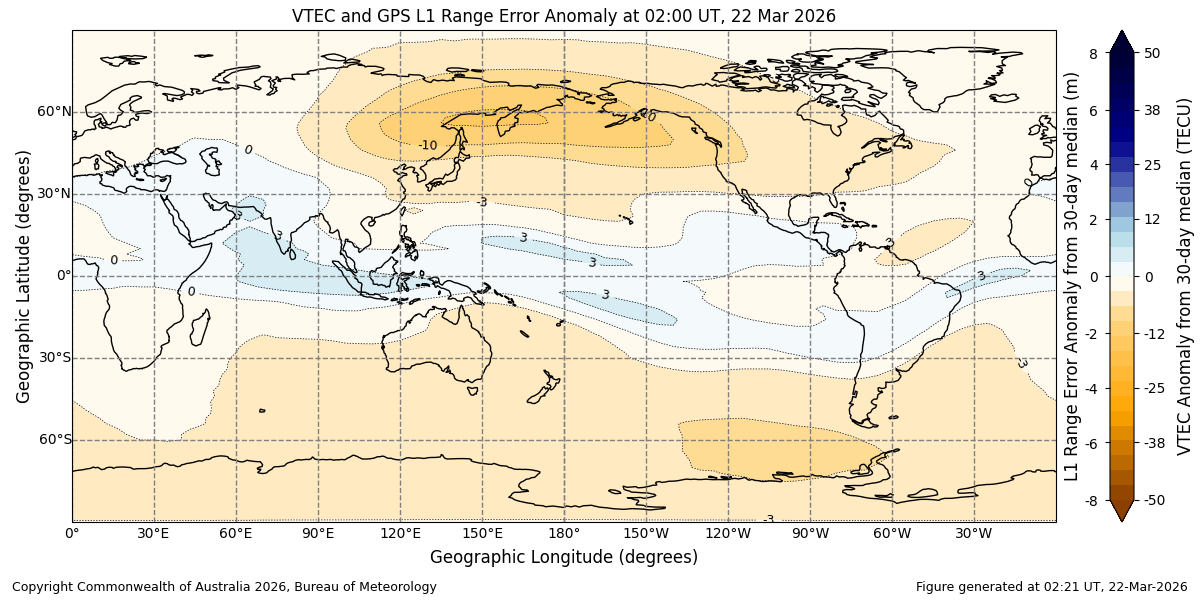
The near-real-time ionospheric VTEC (vertical Total Electron Content) and GPS L1 range error disturbance map (right panel) is produced by the ASWFC by subtracting a dynamically updated recent climatology map (centre panel) from the current ionospheric conditions (left panel). This highlights deviations from average ionospheric behaviour for the current time, day, season, and solar cycle. The disturbance map shows colour contours of VTEC anomaly in units of TECU (1016 electrons/m2) and GPS L1 range error anomaly in units of metre (m).
The data on this map can be used to qualitatively determine whether the ionosphere is mildly enhanced (blue), strongly enhanced (dark blue), mildly depressed (orange), strongly depressed (dark orange), or near expected monthly values (white).
These maps are useful for a range of customers who rely on reliable radio signals and precise positioning. This includes users of GNSS and GPS based services, such as aviation operators, maritime users, surveyors, precision agriculture, geospatial professionals, and emergency services agencies. HF radio operators, including aviation, defence, and recreational users, may also use these maps to broadly understand whether ionospheric conditions are stronger or weaker than usual.
Strongly enhanced conditions (dark blue) indicate significantly more electrons in the ionosphere than expected. This leads to larger GPS L1 range errors than normal, degraded positioning accuracy, and unexpected HF propagation paths. Strongly depressed conditions (dark orange) indicate fewer electrons than expected. This produces a smaller GPS L1 range error than normal, may contribute to reduced usable HF frequencies and potential communication challenges. Mild changes (light blue or light orange) generally correspond to modest impacts.
Important note for users: These maps are currently based only on output from the IRI 2020 model with the STORM option enabled. No real time ionosonde or GNSS data assimilation has been applied. As a result, there will be occasions where the maps show significant differences from actual ionospheric conditions, especially during rapidly changing space weather events. Work to implement real time data assimilation capability and improve model performance is ongoing.
