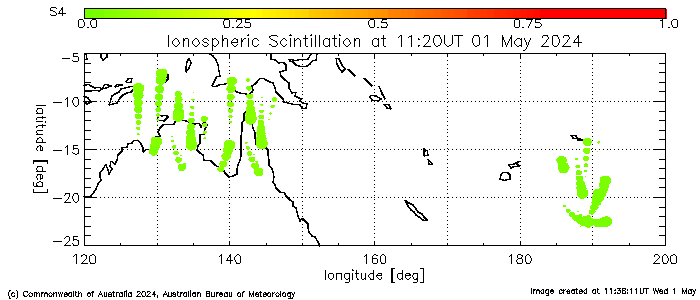
Regional Map
Updates: Every 10 minutes

Your browser has javascript disabled. With javascript enabled you would see control buttons here to enable viewing up the last 3 days of TEC map images interactively.
This map is derived from ASWFC Ionospheric Scintillation Monitor (ISM) sites in Darwin and Weipa. Scintillation data from each GPS satellite traced is mapped to the approximate location at which the line of sight pierces the ionosphere. The colours show the 80% percentile of the S4 index over 15 minute intervals and the size of the plot marker indicates the age of the data, with the most recent data shown with larger dots.
Scintillation above an S4 index of around 0.3 may begin to interfere with satellite communication and navigation and values above 0.6 may have severe effects. For more information, please visit the About Ionospheric Scintillation page. See also the ISM plots page for more detailed presentation of ISM data over the last 24 hours from the ASWFC ISM network.
ASWFC provides a free email alert for adverse Ionospheric Scintillation conditions observed in the ISM network. To subscribe, please visit the Ionospheric Scintillation alert page.
Ionospheric scintillation products and services are under ongoing development, and your feedback is valuable to us. If you are experiencing problems with ionospheric scintillation in GPS receivers or satellite communications equipment, or have a suggestion on ways we may improve our scintillation-related services, please contact ASWFC.


