Australian Antarctic Division Cosmic Ray Real Time Data at ASWFC

Historical Australian Antarctic Division Cosmic Ray data from Kingston in Tasmania, and Mawson in Antarctica are available in the ASWFC World Data Centre.
NOTE: Kingston data no longer available due to equipment failure.
Background
Cosmic rays consist mainly of protons. They can originate from galactic cosmic radiation or from the Sun. Cosmic rays are observed indirectly by a device known as a neutron monitor. When cosmic ray particles enter the Earth's atmosphere they interact with the nuclei of the air molecules to produce secondary radiation. This consists of pions (which decay to muons) and a shower of protons and neutrons. The neutrons predominate in this secondary radiation because the protons, being charged are more easily attenuated in subsequent travel. The cosmic ray detector actual detects these secondary neutrons and as a consequence is referred to as a neutron monitor.
Cosmic Ray Data Applications to Space Weather Forecasting
Forbush Decrease Event
The magnetic fields entrapped in and around coronal mass ejections exert a shielding effect on the galactic cosmic radiation (GCR) which is detected by the neutron monitors. This causes a reduction in the count rate from the monitor. The reduction is typically from about 3 to 20%. The reduction occurs typically over a timescale of several hours to a few days.
Forbush decrease events must be at least 3% for a Forbush decrease alert to be issued.
The reduction in the GCR due to a coronal mass ejection (CME) is dependent upon:
- the size of the CME
- the strength of the magnetic fields in the CME
- the proximity of the CME to the Earth
Because the reduction is dependent on three factors (rather than one), it is difficult to forecast the time from a Forbush Decrease to the arrival of a coronal mass ejection at the Earth. However, previous experience in ASWFC is that a Forbush Decrease is a reliable indicator of a geomagnetic storm, and that warning times of up to 24 hours or more may be made. The Forbush Decrease can be used in conjunction with other indications (eg coronagraph imagery) to further confirm the event. Detection of a Forbush Decrease is in use at the ASWFC for assistance in prediction of geomagnetic storms.
Ground Level Event
In this case, an increase in detector count rate is not due to galactic cosmic radiation, but to the addition of solar cosmic (high energy) radiation (solar cosmic rays) from an previous solar particle event (SPE). The increase in the count rate may be from about 3 to 10,000%. The increase from ambient to peak count rate may take only a few minutes (fast high energy event) to an hour or two (slow and usually lower energy event). The return of the count rate to galactic cosmic ray background may take anywhere from a few hours to a few days.
Neutron Monitor Data from Mawson, Antarctica
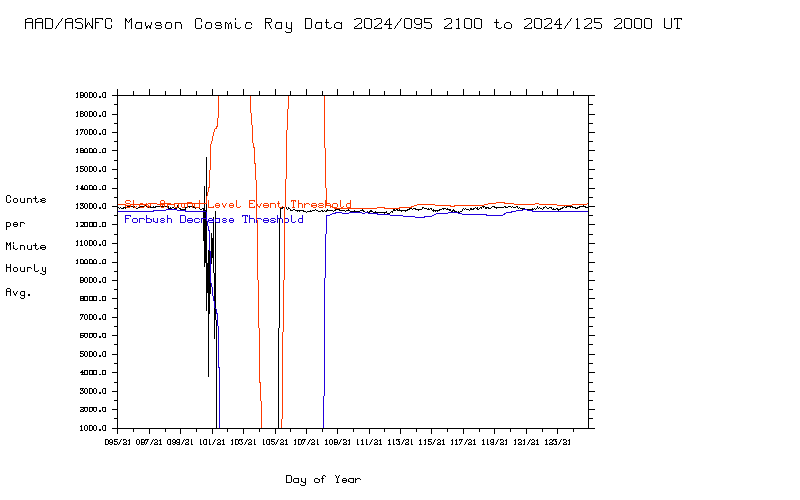
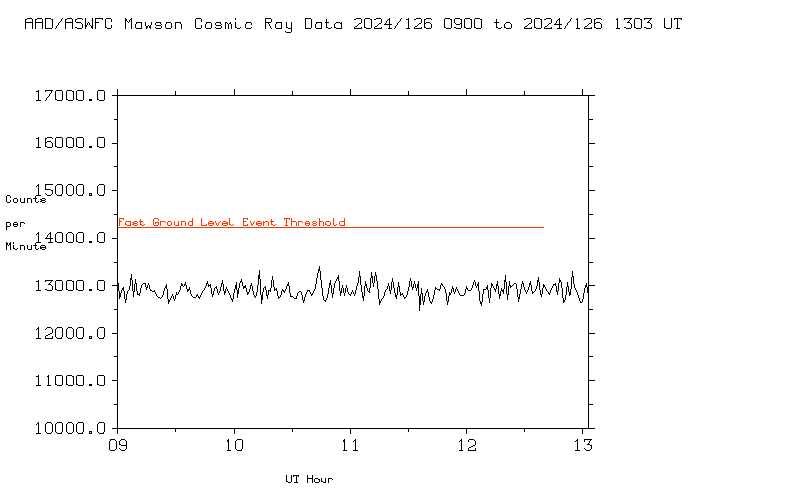
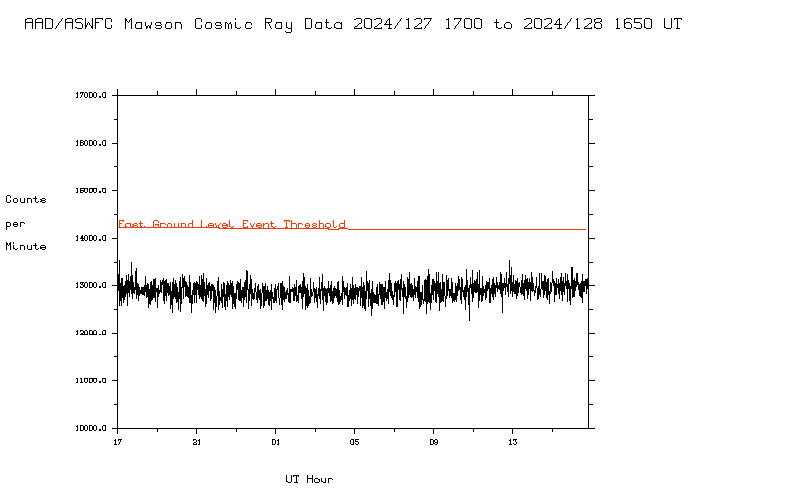
Data is transferred at 5 minute intervals, 1 record per minute. For slow ground level event detection (increase in count rate) and forbush decrease (decrease in count rate) hourly averages of the minute data are used. Alert thresholds (above and below) have been set at 4 times the standard deviation obtained over a 48 hour period. In addition Forbush decrease events must be at least 3% for a ASWFC Forbush Decrease alert to be issued. The threshold shown in the plots are the 5 times standard deviation threshold. The requirement of at least a 3% decrease is necessary for when the cosmic ray data exhibits very little variation, bringing the 4 times standard variation threshold potentially very close in counts to small data count fluctuations, increasing the risk of false alarms being produced.
For fast ground level events the minute data is used with a increase perentage threshold of 10%.
To try and minimize GLE false alarms the GOES solar xray flux must also be greater than M5 at the time of detection of the GLE.
The above thresholds are experimental and may need to be adjusted with experience.
The data displayed below is provided by the Australian Antarctic program in near real time. A neutron monitor located in Antarctica has no geomagnetic (lower) cutoff energy (although there is atmospheric cutoff energy), and thus provides the most sensitive indication of cosmic radiation of any sensor located on the Earth's surface.
Realtime Cosmic Ray detectors (Neutron Monitors) operated by other organizations are also available:
Fast Ground Level Event Detection Plots
Latest Minute Data:

Minute Data over last 24 hours:

Log of Fast Ground Level Events:
(last updated 08 Feb 2026 22:15 UT)
Priority Ground Level Event Observed at MAW 03/11/2025 DOY: 307 Hour: 09UT Count: 16736.8 Upper Alarm Level: 13707.0 Priority Ground Level Event Observed at MAW 11/11/2025 DOY: 315 Hour: 10UT Count: 13428.4 Upper Alarm Level: 12801.0
Slow Ground Level Event and Forbush Decrease Detection Plot
Hourly Averaged Data:

Log of Detected Forbush Decrease Events and Slow Ground Level Events:
Slow Ground Level Event Observed at MAW 28/10/2021 DOY: 301 Hour: 22UT Count: 16709.3 Avg: 14501.5 Upper Alarm Level 16007.3 Forbush Decrease Observed ( 3%) at MAW 13/03/2022 DOY: 72 Hour: 22UT Count: 14082.0 Avg: 14531.5 Lower Alarm Level: 14110.0 Forbush Decrease Observed ( 4%) at MAW 14/03/2022 DOY: 73 Hour: 04UT Count: 13846.3 Avg: 14506.6 Lower Alarm Level: 13879.8 Forbush Decrease Observed ( 3%) at MAW 31/03/2022 DOY: 90 Hour: 20UT Count: 13874.7 Avg: 14308.1 Lower Alarm Level: 13939.4 Forbush Decrease Observed ( 3%) at MAW 16/06/2022 DOY: 167 Hour: 02UT Count: 13727.7 Avg: 14159.5 Lower Alarm Level: 13770.9 Forbush Decrease Observed ( 3%) at MAW 12/07/2022 DOY: 193 Hour: 19UT Count: 13812.3 Avg: 14280.4 Lower Alarm Level: 13825.1 Forbush Decrease Observed ( 3%) at MAW 23/07/2022 DOY: 204 Hour: 05UT Count: 13529.7 Avg: 13962.9 Lower Alarm Level: 13575.3 Forbush Decrease Observed ( 3%) at MAW 20/08/2022 DOY: 232 Hour: 00UT Count: 13331.3 Avg: 13801.6 Lower Alarm Level: 13421.2 Forbush Decrease Observed ( 3%) at MAW 01/10/2022 DOY: 274 Hour: 01UT Count: 13281.0 Avg: 13713.9 Lower Alarm Level: 13356.8 Forbush Decrease Observed ( 3%) at MAW 15/03/2023 DOY: 74 Hour: 08UT Count: 13035.3 Avg: 13450.2 Lower Alarm Level: 13234.9 Forbush Decrease Observed ( 3%) at MAW 23/03/2023 DOY: 82 Hour: 21UT Count: 12575.3 Avg: 12969.7 Lower Alarm Level: 12674.1 Forbush Decrease Observed ( 3%) at MAW 18/04/2023 DOY: 108 Hour: 19UT Count: 12909.7 Avg: 13319.1 Lower Alarm Level: 13028.5 Slow Ground Level Event Observed at MAW 21/04/2023 DOY: 111 Hour: 00UT Count: 15175.3 Avg: 13086.7 Upper Alarm Level 13532.1 Forbush Decrease Observed ( 3%) at MAW 23/04/2023 DOY: 113 Hour: 20UT Count: 12746.0 Avg: 13190.4 Lower Alarm Level: 12944.0 Slow Ground Level Event Observed at MAW 07/06/2023 DOY: 158 Hour: 17UT Count: 15197.3 Avg: 13241.9 Upper Alarm Level 13533.7 Forbush Decrease Observed ( 3%) at MAW 02/08/2023 DOY: 214 Hour: 05UT Count: 12691.0 Avg: 13088.5 Lower Alarm Level: 12833.4 Forbush Decrease Observed ( 3%) at MAW 18/09/2023 DOY: 261 Hour: 18UT Count: 12649.3 Avg: 13049.5 Lower Alarm Level: 12821.5 Forbush Decrease Observed ( 4%) at MAW 19/09/2023 DOY: 262 Hour: 00UT Count: 12473.0 Avg: 13013.2 Lower Alarm Level: 12549.8 Forbush Decrease Observed ( 3%) at MAW 25/09/2023 DOY: 268 Hour: 05UT Count: 12467.0 Avg: 12863.4 Lower Alarm Level: 12481.2 Forbush Decrease Observed ( 3%) at MAW 06/11/2023 DOY: 310 Hour: 00UT Count: 12568.3 Avg: 13029.1 Lower Alarm Level: 12588.5 Forbush Decrease Observed ( 3%) at MAW 25/11/2023 DOY: 329 Hour: 13UT Count: 12667.0 Avg: 13059.1 Lower Alarm Level: 12893.4 Forbush Decrease Observed ( 3%) at MAW 26/11/2023 DOY: 330 Hour: 00UT Count: 12604.7 Avg: 13033.3 Lower Alarm Level: 12685.6 Forbush Decrease Observed ( 3%) at MAW 01/12/2023 DOY: 335 Hour: 23UT Count: 12339.0 Avg: 12783.1 Lower Alarm Level: 12431.3 Forbush Decrease Observed ( 3%) at MAW 24/03/2024 DOY: 84 Hour: 17UT Count: 12495.3 Avg: 12903.7 Lower Alarm Level: 12691.5 Slow Ground Level Event Observed at MAW 10/04/2024 DOY: 101 Hour: 11UT Count: 18430.7 Avg: 12933.2 Upper Alarm Level 13156.4 Slow Ground Level Event Observed at MAW 10/04/2024 DOY: 101 Hour: 20UT Count: 17364.0 Avg: 12613.8 Upper Alarm Level 16505.8 Slow Ground Level Event Observed at MAW 15/04/2024 DOY: 106 Hour: 01UT Count: 15.0 Avg: 9.9 Upper Alarm Level 13.4 Slow Ground Level Event Observed at MAW 15/04/2024 DOY: 106 Hour: 07UT Count: 12878.7 Avg: 10.1 Upper Alarm Level 14.6 Forbush Decrease Observed ( 3%) at MAW 10/05/2024 DOY: 131 Hour: 21UT Count: 12515.3 Avg: 12978.3 Lower Alarm Level: 12784.7 Forbush Decrease Observed ( 3%) at MAW 31/07/2024 DOY: 213 Hour: 23UT Count: 12534.7 Avg: 12944.4 Lower Alarm Level: 12552.4 Forbush Decrease Observed ( 3%) at MAW 11/08/2024 DOY: 224 Hour: 03UT Count: 12438.3 Avg: 12872.1 Lower Alarm Level: 12622.7 Forbush Decrease Observed ( 3%) at MAW 17/09/2024 DOY: 261 Hour: 14UT Count: 11996.0 Avg: 12416.0 Lower Alarm Level: 12240.1 Slow Ground Level Event Observed at MAW 08/10/2024 DOY: 282 Hour: 00UT Count: 9287.0 Avg: 1126.2 Upper Alarm Level 8293.2 Slow Ground Level Event Observed at MAW 09/10/2024 DOY: 283 Hour: 00UT Count: 6293.5 Avg: 889.1 Upper Alarm Level 4334.4 Slow Ground Level Event Observed at MAW 09/10/2024 DOY: 283 Hour: 09UT Count: 2679.7 Avg: 837.4 Upper Alarm Level 2662.4 Slow Ground Level Event Observed at MAW 09/10/2024 DOY: 283 Hour: 15UT Count: 2694.3 Avg: 817.0 Upper Alarm Level 937.9 Slow Ground Level Event Observed at MAW 10/10/2024 DOY: 284 Hour: 00UT Count: 6329.0 Avg: 811.3 Upper Alarm Level 922.1 Slow Ground Level Event Observed at MAW 10/10/2024 DOY: 284 Hour: 07UT Count: 2682.3 Avg: 804.3 Upper Alarm Level 906.1 Slow Ground Level Event Observed at MAW 10/10/2024 DOY: 284 Hour: 13UT Count: 2625.0 Avg: 797.2 Upper Alarm Level 890.5 Slow Ground Level Event Observed at MAW 11/10/2024 DOY: 285 Hour: 00UT Count: 6162.3 Avg: 792.9 Upper Alarm Level 891.3 Slow Ground Level Event Observed at MAW 11/10/2024 DOY: 285 Hour: 06UT Count: 2408.3 Avg: 783.8 Upper Alarm Level 1441.5 Slow Ground Level Event Observed at MAW 11/10/2024 DOY: 285 Hour: 12UT Count: 2471.3 Avg: 767.9 Upper Alarm Level 1440.3 Slow Ground Level Event Observed at MAW 12/10/2024 DOY: 286 Hour: 02UT Count: 2460.3 Avg: 763.7 Upper Alarm Level 1476.9 Slow Ground Level Event Observed at MAW 12/10/2024 DOY: 286 Hour: 08UT Count: 2494.7 Avg: 746.6 Upper Alarm Level 1467.6 Slow Ground Level Event Observed at MAW 12/10/2024 DOY: 286 Hour: 14UT Count: 2513.7 Avg: 728.4 Upper Alarm Level 1447.2 Slow Ground Level Event Observed at MAW 13/10/2024 DOY: 287 Hour: 00UT Count: 6025.0 Avg: 719.9 Upper Alarm Level 1420.4 Slow Ground Level Event Observed at MAW 13/10/2024 DOY: 287 Hour: 06UT Count: 2478.0 Avg: 708.0 Upper Alarm Level 1399.1 Slow Ground Level Event Observed at MAW 13/10/2024 DOY: 287 Hour: 12UT Count: 2600.3 Avg: 701.7 Upper Alarm Level 1381.2 Slow Ground Level Event Observed at MAW 14/10/2024 DOY: 288 Hour: 00UT Count: 3504.0 Avg: 693.2 Upper Alarm Level 824.3 Slow Ground Level Event Observed at MAW 14/10/2024 DOY: 288 Hour: 06UT Count: 2644.3 Avg: 709.0 Upper Alarm Level 899.1 Slow Ground Level Event Observed at MAW 14/10/2024 DOY: 288 Hour: 12UT Count: 2571.3 Avg: 727.4 Upper Alarm Level 950.9 Slow Ground Level Event Observed at MAW 15/10/2024 DOY: 289 Hour: 00UT Count: 6386.5 Avg: 734.5 Upper Alarm Level 968.4 Slow Ground Level Event Observed at MAW 15/10/2024 DOY: 289 Hour: 06UT Count: 2689.0 Avg: 749.3 Upper Alarm Level 983.9 Slow Ground Level Event Observed at MAW 15/10/2024 DOY: 289 Hour: 12UT Count: 2755.7 Avg: 766.3 Upper Alarm Level 992.0 Slow Ground Level Event Observed at MAW 16/10/2024 DOY: 290 Hour: 00UT Count: 6533.0 Avg: 782.5 Upper Alarm Level 974.9 Slow Ground Level Event Observed at MAW 16/10/2024 DOY: 290 Hour: 06UT Count: 2671.3 Avg: 795.5 Upper Alarm Level 946.4 Slow Ground Level Event Observed at MAW 16/10/2024 DOY: 290 Hour: 12UT Count: 2708.3 Avg: 805.9 Upper Alarm Level 914.4 Slow Ground Level Event Observed at MAW 17/10/2024 DOY: 291 Hour: 00UT Count: 6539.0 Avg: 811.6 Upper Alarm Level 900.3 Slow Ground Level Event Observed at MAW 17/10/2024 DOY: 291 Hour: 06UT Count: 2665.0 Avg: 810.6 Upper Alarm Level 902.7 Slow Ground Level Event Observed at MAW 17/10/2024 DOY: 291 Hour: 12UT Count: 2696.3 Avg: 806.5 Upper Alarm Level 909.3 Slow Ground Level Event Observed at MAW 18/10/2024 DOY: 292 Hour: 00UT Count: 6595.5 Avg: 802.2 Upper Alarm Level 917.1 Slow Ground Level Event Observed at MAW 18/10/2024 DOY: 292 Hour: 06UT Count: 2717.3 Avg: 797.1 Upper Alarm Level 918.7 Slow Ground Level Event Observed at MAW 18/10/2024 DOY: 292 Hour: 12UT Count: 2673.0 Avg: 792.4 Upper Alarm Level 908.5 Slow Ground Level Event Observed at MAW 19/10/2024 DOY: 293 Hour: 00UT Count: 3656.5 Avg: 789.5 Upper Alarm Level 899.8 Slow Ground Level Event Observed at MAW 19/10/2024 DOY: 293 Hour: 06UT Count: 2704.0 Avg: 789.0 Upper Alarm Level 898.2 Slow Ground Level Event Observed at MAW 19/10/2024 DOY: 293 Hour: 12UT Count: 2738.7 Avg: 788.4 Upper Alarm Level 895.8 Slow Ground Level Event Observed at MAW 20/10/2024 DOY: 294 Hour: 00UT Count: 6642.0 Avg: 786.6 Upper Alarm Level 887.3 Slow Ground Level Event Observed at MAW 20/10/2024 DOY: 294 Hour: 06UT Count: 2753.0 Avg: 785.8 Upper Alarm Level 885.8 Slow Ground Level Event Observed at MAW 20/10/2024 DOY: 294 Hour: 12UT Count: 2737.3 Avg: 786.7 Upper Alarm Level 885.0 Slow Ground Level Event Observed at MAW 21/10/2024 DOY: 295 Hour: 00UT Count: 3736.5 Avg: 787.7 Upper Alarm Level 883.8 Slow Ground Level Event Observed at MAW 21/10/2024 DOY: 295 Hour: 06UT Count: 2668.0 Avg: 785.4 Upper Alarm Level 892.9 Slow Ground Level Event Observed at MAW 21/10/2024 DOY: 295 Hour: 12UT Count: 2722.0 Avg: 782.2 Upper Alarm Level 901.0 Slow Ground Level Event Observed at MAW 21/10/2024 DOY: 295 Hour: 18UT Count: 2680.3 Avg: 774.6 Upper Alarm Level 912.1 Slow Ground Level Event Observed at MAW 22/10/2024 DOY: 296 Hour: 00UT Count: 3665.0 Avg: 773.3 Upper Alarm Level 914.6 Slow Ground Level Event Observed at MAW 22/10/2024 DOY: 296 Hour: 06UT Count: 2678.7 Avg: 761.3 Upper Alarm Level 918.9 Slow Ground Level Event Observed at MAW 22/10/2024 DOY: 296 Hour: 12UT Count: 2729.7 Avg: 749.8 Upper Alarm Level 902.9 Slow Ground Level Event Observed at MAW 23/10/2024 DOY: 297 Hour: 00UT Count: 6637.5 Avg: 743.2 Upper Alarm Level 885.6 Slow Ground Level Event Observed at MAW 23/10/2024 DOY: 297 Hour: 06UT Count: 2732.0 Avg: 740.2 Upper Alarm Level 872.9 Forbush Decrease Observed ( 3%) at MAW 01/06/2025 DOY: 152 Hour: 08UT Count: 11934.7 Avg: 12366.1 Lower Alarm Level: 12189.0 Forbush Decrease Observed (13%) at MAW 01/06/2025 DOY: 152 Hour: 16UT Count: 10561.7 Avg: 12260.9 Lower Alarm Level: 11049.3 Slow Ground Level Event Observed at MAW 05/06/2025 DOY: 156 Hour: 00UT Count: 12772.3 Avg: 10989.3 Upper Alarm Level 11905.8 Forbush Decrease Observed ( 3%) at MAW 02/09/2025 DOY: 245 Hour: 00UT Count: 11838.7 Avg: 12227.5 Lower Alarm Level: 11995.1 Forbush Decrease Observed ( 6%) at MAW 07/09/2025 DOY: 250 Hour: 02UT Count: 11396.3 Avg: 12151.8 Lower Alarm Level: 11456.0 Forbush Decrease Observed ( 3%) at MAW 28/09/2025 DOY: 271 Hour: 22UT Count: 12085.7 Avg: 12483.6 Lower Alarm Level: 12146.5 Forbush Decrease Observed ( 6%) at MAW 07/11/2025 DOY: 311 Hour: 12UT Count: 11362.7 Avg: 12128.6 Lower Alarm Level: 11405.7 Slow Ground Level Event Observed at MAW 11/11/2025 DOY: 315 Hour: 10UT Count: 14342.3 Avg: 11533.9 Upper Alarm Level 12139.6 Forbush Decrease Observed ( 3%) at MAW 04/12/2025 DOY: 338 Hour: 01UT Count: 12120.3 Avg: 12514.2 Lower Alarm Level: 12351.9 Forbush Decrease Observed (34%) at MAW 31/12/2025 DOY: 365 Hour: 19UT Count: 35.7 Avg: 54.2 Lower Alarm Level: 41.5 Forbush Decrease Observed (22%) at MAW 01/01/2026 DOY: 1 Hour: 04UT Count: 59.7 Avg: 77.2 Lower Alarm Level: 76.5 Slow Ground Level Event Observed at MAW 01/01/2026 DOY: 1 Hour: 10UT Count: 110.7 Avg: 49.9 Upper Alarm Level 99.7 Slow Ground Level Event Observed at MAW 01/01/2026 DOY: 1 Hour: 18UT Count: 89.7 Avg: 47.8 Upper Alarm Level 87.0 Slow Ground Level Event Observed at MAW 04/01/2026 DOY: 4 Hour: 02UT Count: 134.7 Avg: 67.6 Upper Alarm Level 133.6 Forbush Decrease Observed (36%) at MAW 04/01/2026 DOY: 4 Hour: 23UT Count: 81.3 Avg: 128.2 Lower Alarm Level: 102.2 Forbush Decrease Observed (14%) at MAW 07/01/2026 DOY: 7 Hour: 01UT Count: 75.0 Avg: 88.0 Lower Alarm Level: 88.0 Slow Ground Level Event Observed at MAW 09/01/2026 DOY: 9 Hour: 08UT Count: 3526.3 Avg: 667.0 Upper Alarm Level 3035.0 Slow Ground Level Event Observed at MAW 10/01/2026 DOY: 10 Hour: 05UT Count: 3278.7 Avg: 2813.8 Upper Alarm Level 3267.7 Slow Ground Level Event Observed at MAW 10/01/2026 DOY: 10 Hour: 14UT Count: 5725.7 Avg: 3140.0 Upper Alarm Level 4215.0 Slow Ground Level Event Observed at MAW 14/01/2026 DOY: 14 Hour: 02UT Count: 10787.3 Avg: 2848.5 Upper Alarm Level 4102.8 Slow Ground Level Event Observed at MAW 15/01/2026 DOY: 15 Hour: 11UT Count: 5374.0 Avg: 2889.6 Upper Alarm Level 3722.7 Slow Ground Level Event Observed at MAW 15/01/2026 DOY: 15 Hour: 17UT Count: 8797.7 Avg: 3269.7 Upper Alarm Level 8390.9 Slow Ground Level Event Observed at MAW 27/01/2026 DOY: 27 Hour: 04UT Count: 8444.7 Avg: 8104.0 Upper Alarm Level 8403.3 Slow Ground Level Event Observed at MAW 27/01/2026 DOY: 27 Hour: 10UT Count: 12252.7 Avg: 8191.2 Upper Alarm Level 9966.9


