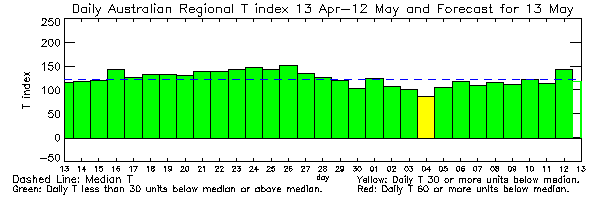
T Index Plot
This plot shows the trend in the observed Australian regional T index over the past 30 days. The daily values can fluctuate during disturbances. The blue dashed line represents the median of these daily values and is an indicator of the quiet level of ionospheric support over the period plotted. The forecast daily T index for the current UT day is shown as the unfilled rectangle.


