The Distribution in X-Ray Class of Solar Flares
For some prediction purposes it is useful to know how many X-ray flares of a given energy might be expected. For example, if the predicted yearly sunspot number for 1994 is 30, how many flares of class M1-2 or X1-2 might be expected during the year. These sort of estimates have particular value when combined with other information to yield estimates of fadeout effects on HF circuits.
The following equations are useful in making such estimates. The first, derived from flare data between 1976 and 1991, connects sunspot number R12 and the total number of M Class flares (Nm) in a year:
Nm = 2.86 R12
There is a similar relationship, but between sunspot number and the total number of X Class flares in a year:
Nx = 0.23 R12
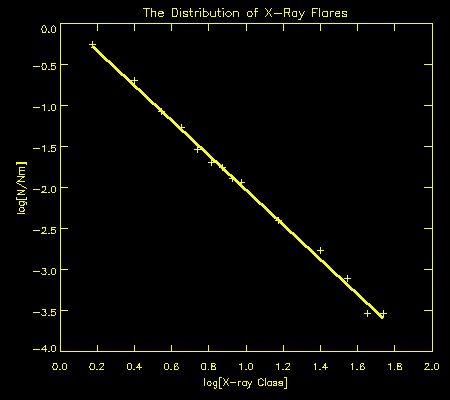
Another equation gives the distribution of flares in X-ray class as derived from flare data from 1976 to mid 1993:
N = Nm DELTA 1.26 X-2.12
where:
- X is the X-ray class measured as 1.0 for M1, 5.0 for M5, and 10.0 for X1 and so on
- N is the expected number of flares in a range DELTA centred on an X-ray class of X
To calculate the number of flares in a range M1-2, the above equation can be used with X = 1.5 and DELTA = 1.0. Similarly, for a range X1-2, X = 15 and DELTA = 10.
The figure below shows flare occurrence plotted against X-ray class, indicating that the third of the above equations gives a good fit right from class M1 through to X5.
It should be stressed that the equations above are statistical in nature whilst flares, even at solar minimum, come in clumps where the expected yearly occurrence may be produced within several weeks. Nevertheless, in the absence of more detailed knowledge, the equations produce estimates which are useful for planning purposes. Naturally, the random nature of flares is more apparent and the equations less useful, when short time intervals are used.

Material prepared by Richard Thompson


