Solar Flare Patrol
Solar flares are transient brightenings of the chromosphere that may last for a few minutes to a few hours. The energy released in a solar flare may reach up to 1025joule. Most flares are only visible by observing various spectral lines with a narrow band filter. However, the highest energy and brightest flares may by seen in unfiltered white light. These flares however, are very rare, and can be expected to occur on average about 5 times per solar cycle. A broad band filter in the blue part of the spectrum (such as a Kodak Wratten #47) will substantially improve the chances of seeing a solar flare in continuum light, and at times of solar maximum, such a filter may allow the observation of a dozen flares or more per year.
Typically the Hydrogen-alpha spectral line, at a wavelength of 656.3 nanometres is used for solar flare patrol. A filter with a passband of 1/4 to 1/2 Angstrom (0.025 - 0.05 nm) is commonly used for this application. A tunable filter is an asset to examine chromospheric motions associated with many flares, and the spectral width of a flare may also be used to indicate the brightness category of a flare if accurate photometry is not available.
In general flares will occur close to an active region, but occasionally a flare may occur well away from an active region, but associated with a large dark filament. These are termed Hyder flares.
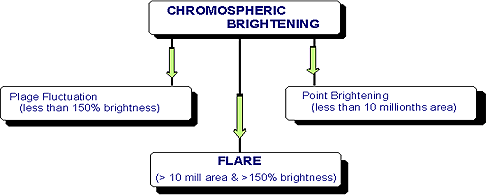
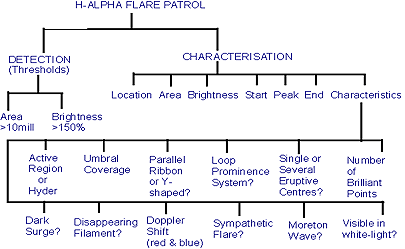
There are two aspects to flare patrol: detection of a flare, followed by characterisation of the flare. Although a flare is defined as a transient brightening of the chromosphere, there are forms of chromospheric brightening which are not classed as flares. These are related to both the brightness and the area of the brightening, and it is these two characteristics which define when a flare has occurred.

To be classified as a flare, the chromospheric brightening must exceed an area threshold and a brightness threshold. For H-alpha observations, the brightness threshold is 150% of the chromospheric background, and the area threshold is ten millionths of the visible solar hemisphere. A brightening which has less than 150% of chromospheric background (even though it may have more than 10 millionths area) is termed a plage fluctuation. A small brightening which exceeds 150% of chromospheric background but less than 10 millionths hemispheric area is termed a point brightening.
Once a flare has been detected it must then be characterised:

There are six essential characteristics by which a flare is usually described. To these may be added several associated characteristics. These secondary features are usually added because of the information they potentially convey about possible geoeffective events that might be associated with the flare. Some of these may point toward associated coronal mass ejections; some may indicate high temperature flares which typically are associated with high energy particle emission.
Flare Times
The temporal behaviour of a flare is denoted by specifying a start time, a peak time and an end time.The start of the flare is defined as the time at which the flare first exceeded both the area and the brightness thresholds. The peak time of the flare is the time of maximum brightness of any region of the flare that exceeds at least 10 millionths hemispherical area. It is not the time at which the flare displays a maximum area (exceeding 150% background). This time in most flares, occurs after the time of peak brightness. The end time of the flare is the time when the area of the flare which exceeds 150% of chromospheric background intensity falls below 10 millionths.
Flare Location
The location of a flare is usually specified by noting the heliographic coordinates of the geometric centre of the flaring areas (of which there may be several). The heliographic coordinates are the latitude and the central meridian distance of the flare centre. These are measured either with a Stoneyhurst overlay or with computer assistance if the image is digital. The solar P angle (tilt of the solar central meridian from the Earth based north-south line in the viewing plane), and the solar B angle (tilt of the solar polar axis perpendicular to the observing plane or solar disc), must be taken into account in the computation of the coordinates. Descriptively, the location of a flare may also be described in relation to a nearby prominent solar feature (eg sunspot, large filament, etc).
In practice, an observer should not agonise over determination of the geometric centre of the flare. It is generally adequate to mentally draw a rectangular box around the flaring areas, and then to measure the coordinates of the centre of the box.
Flare Area
The area of a flare is commonly measured in units of one millionth of the visible solar hemisphere. One millionth of the hemisphere is approximately 3 million square kilometres. In the past, the unit of heliocentric square degrees was also used. This is the square area which subtends, at the solar centre, an angle of one degree of arc on each side. One square degree so defined is equivalent to an area of 48.5 hemispheric millionths. An even more obscure unit is the solid angle subtended at the Earth by one square degree on the Sun at the centre of the solar disc. This solid angle is 16.73 square seconds of arc.
Table 1: SOLAR AREA CONVERSION
| Millionths of Hemisphere | Square Kilometres | Square Degrees |
|---|---|---|
| 10 | 30 million | 0.2 |
| 100 | 300 million | 2.1 |
| 250 | 761 million | 5.2 |
| 600 | 1826 million | 12.4 |
| 1200 | 3653 million | 24.7 |
The determination of flare area is normally accomplished by "counting the squares" of a grid overlayed upon the image, or the digital analog thereof. However, this value must be corrected for foreshortening as the area in question moves closer to the limb. This presents a peculiar problem for the Sun, as flares also have a significant altitudinal (height) extent, and a limb flare may have its area grossly overestimated if a standard mathematical correction is used.
To overcome this problem, Smith and Smith (Solar Flares) analysed 4700 flares observed at the Sacramento Peak Observatory (New Mexico), and using statistical techniques arrived at the following correction formula:
Ac = (Am / 2) / (0.2×Rv + √(1 - Rv×Rv))
where:
- Ac is the corrected area in millionths of the solar hemisphere
- Am is the measured area in millionths of the solar disc
- Rv = r / R is the fractional radius of the flare centre (this may be measured on the disc in any units since r is the distance from the disc centre to the point in question and R is the radius of the disc)
Note that the factor of 2 converts from disc area to hemispheric area (since disc area is pR2 (p = pi) and hemispheric area is 2pR2). The term under the radical is the standard limb correction, whereas the 0.2Rv term is the correction for non-zero altitude.
The above expression is sometimes written as:
Ac = Ah / (0.2 sin(q) + cos(q))
This is in fact identical with first expression, because the angle q is the angle subtended at the Sun's centre by the great circle joining the centre of the disc and the measured point, and sine of this angle (q) equals r / R .
When a flare is classified by a single measurement of area, it is that area which exceeds 150% of chromospheric background at the time of peak brightness, NOT at the time of maximum area (which, as previously stated, usually occurs later in the flare evolution). When this has been measured and corrected, the flare is then given an importance category as follows:
Table 2: FLARE AREA
| Importance (Class) | Corrected Area (Millionths of Hemisphere) |
|---|---|
| 0 | 10 <= area < 100 |
| 1 | 100 <= area < 250 |
| 2 | 250 <= area < 600 |
| 3 | 600 <= area < 1200 |
| 4 | area >= 1200 |
Flare Brightness
Flare brightness is probably one of the least useful and least reproducible parameters of flare characterisation, depending strongly on the characteristics of the H-alpha filter employed. Because of this and other reasons, the brightness of a flare has only limited correlation with the total energy release during the flare phenomenon, and is thus of minor usefulness in trying to determine the resultant effects of the flare.
When photometry is available (either photographic or digital), a flare may be classified into one of three categories: F (faint), N (normal) or B (brilliant), according to the peak brightness of any area which exceeds 10 millionths hemispheric area, as specified in the table above. Note that the background chromospheric intensity should be measured in the same general area of the flare to compensate for limb darkening effects.
If photometry is not available, but the H-alpha filter can be tuned off-band, then the total bandwidth of the most brilliant parts of the flare may be used as a surrogate to try and estimate the brightness category. (Note that this might also be used as a surrogate detection threshold). Thus a faint flare must have a bandwidth of 0.8 Angstrom (0.08 nanometre) over which at least 10 millionths hemispheric area can be clearly seen. This bandwidth may be asymmetrically displaced around the H-alpha line centre (eg, from +0.2 to -0.6 A).
Note that terrestrial atmospheric and local equipment changes (both optical, photographic and electronic) can change the background solar light levels, and photometry must be standardised to the current and local chromospheric background.
It should also be noted that in photographic and electronic systems, a solar image adjusted for best visual display will invariably have insufficient dynamic range (intensity overhead) to allow the measurement of an unsaturated brilliant flare intensity. This point must be carefully considered in any flare patrol system. It might be necessary to maintain two image paths - a high light level path for visual observations, and a low level light path for flare brightness determination.
Table 3: FLARE BRIGHTNESS
| Designator (Class) | Brightness (% of Background) | Surrogate (total bandwidth) |
|---|---|---|
| F (faint) | 160% <= brightness < 260% | 0.08nm <= bandwidth < 0.12 nm |
| N (normal) | 260% <= brightness < 360% | 0.12nm <= bandwidth < 0.2 nm |
| B (Brilliant) | brightness >= 360% | bandwidth >=0.2 nm |
Secondary Flare Characteristics
There are many secondary characteristics that may be associated with a flare and different organisations choose to report varying subsets of these. Some parameters indicate high temperature flares, some indicate associated coronal mass ejections, and others have questionable correlations with any significant effects. Some of the potentially more useful are discussed below.
Active Region or Hyder Flare
Most flares can be assigned to a particular active region or sunspot grouping. In these cases it is customary to assign the active region number (as designated by the Space Environment Center in Boulder , Colorado, USA) to that flare. A flare not capable of assignation to an active region is most probably a Hyder flare. Such a flare is usually associated with the disappearance of a large dark filament (well away from any active region), and this leads to the assumption that Hyder flares are associated with coronal mass ejections. Some would even add to this the production of energetic particles. While some Hyder flares are certainly associated with both these phenomenon, the empirical evidence does not support the assumption that all are.
Percentage Umbral Coverage
If a flare covers more than 20% of the umbra of the largest spot in the group, this is taken to be indicative of a high energy flare.
Parallel or Y-shaped ribbon flare
Again, a high energy flare will typically display one or more ribbons of flare material parallel to (and often one each side of) the magnetic inversion or neutral line of the region, which separates different polarities of the line of sight component of the magnetic field. This neutral line is often delineated by a dark filament, or a recognisable filament channel.
Associated Loop Prominence System
A loop prominence system (LPS) is definitely associated with higher temperature flares. It appears to be formed from material that has been ejected into the corona which subsequently condenses back down to form a bright top knot above the flaring region, and from there flows down to the chromosphere along the magnetic arches on each side of the top knot. An arcade or fan of such loops forms the prominence system. An LPS generally forms several minutes after flare peak time, and may persist for one or more hours. It is generally easy to recognise when seen in profile on the limb, but is much harder to recognise as a dark feature seen against the solar disc. Inexperienced observers may confuse material thrown out from a flare which then recurves back to the chromosphere, with an LPS, but the presence of the bright top knot, and the confirmation that material is flowing down on both sides of this knot is a definitive observation for an LPS. There is a high correlation of energetic solar particle events with an LPS.
Number of Eruptive Centres
A flare may erupt from one or more centres. It has traditionally been thought that several eruptive centres may signify greater geoeffective correlations, but this is probably questionable.
Number of Brilliant Points
A faint or normal intensity flare may occasionally have embedded within it one or more points of area less than 10 hemispheric millionths whose brightness exceeds 350% of chromospheric background. The traditional significance of this is that the flare may be of higher energy than indicated by the intensity classification.
Associated Dark Surge
Material may often be seen to be ejected from an energetically flaring region. The material may be seen as a dark surge or spray of material against the brighter disc, although if observed on the limb, it will be seen as bright against the cold sky. Very rarely, very hot material may be observed as bright against the disc. If the speed of the material can be measured, it is sometimes found to exceed the gravitational escape velocity of the Sun (617 km/sec), and presumably escapes into the outer corona.
Associated Disappearing Filament
Frequently, part or all of the dark filament that lies over the neutral or inversion line of the region may be observed to disappear just before or during the progress of a flare. This may indicate an associated coronal mass ejection.
Doppler Shift
If it can be measured, the Doppler shift through which the flare is observed may be recorded. The shift in both the blue and red wings should be indicated separately. As discussed above, this can be used as another indicator of the flare intensity.
Simultaneous or Sympathetic Flares
Most flares occur in isolation, but every so often, two or more flares may start at nearly identical times, even though they lie far apart on the solar disc. This is thought to indicate a magnetic connection between the active regions concerned. The connection was thought to be via magnetic flux beneath the photosphere, but recent work has suggested a possible connection via coronal magnetic fields. Sometimes, a wave may propagate out from one flare (see Moreton wave), and appear to initiate another flare in an adjacent region through which it passes.
Moreton Wave
A flare, like any explosive release, is undoubtedly accompanied, particularly at higher energies, by a shock wave. With the right conditions, this wave can be seen to spread out from the flaring area (like waves in a pond after a stone has been dropped) by changes in the intensity of the background chromosphere. It may appear as an expanding circular ring (normally viewed on time lapse images). Often only part of the circle is apparent. The velocity of expansion is typically around 1000 km/sec.

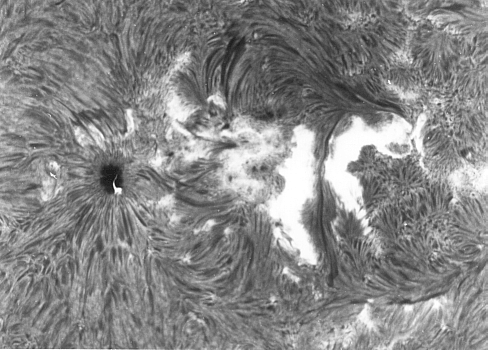
A large parallel ribbon flare - Learmonth Solar Observatory
Material prepared by John Kennewell


