| Back to Bulletins index | Back to INAG-61 Contents page |
Ionospheric sounding at Fortaleza (3o 41'S,38o25'W), in Brazil started in 1975. The ionospheric data collected till 1990 is used to investigate the long term trends in the sporadic E-layer occurrences over this station, where the secular variation of the geomagnetic field has caused a steady drift of the magnetic equator to north of the station. Systematic decrease in the occurrence rates of the q-type Es, accompanied with increases in the l, f, h and c types of Es, was registered from 1975 to 1990, during which period the magnetic equator drifted to north of Fortaleza by ~400 km. This long term trend manifests competing roles of the equatorial electric fields and wind systems, in the generation of the different Es layers as a function of the distance from the electrojet center.
A C-4 ionosonde has been in operation at Fortaleza since 1975. In 1993 this was replaced by a Canadian Advanced Digital Ionosonde (CADI). The data for the month of September from 1975 to 1990 has been used in this report to investigate the long term trends in the occurrence features of the different types of Es layers arising from the natural phenomenon of secular variation of the geomagnetic field. During the initial epoch of ionosonde operation at Fortaleza the magnetic equator, that is, the approximate center of the equatorial electrojet (EEJ) current system was located, according to the International Reference Geomagnetic Field (IGRF) model, ~50 km north of Fortaleza, and with the yearly northward drift rate of ~0.2o, the above distance has increased to ~400 km by the year 1990. This has produced systematic long term changes in the sporadic E-layer features over that station, which is the subject matter of this report. The Es-layer formation for equatorial latitudes is known to be quite different from those for the middle and high latitudes. The well-known gradient drift (that is, ExB drift) mechanism is known to be responsible for the equatorial type (widely known as the q-type) Es-layer that occurs inside the equatorial electrojet (EEJ), whereas other different types of Es-layers (such as the l, f, c and h types (see URSI Handbook of Ionogram Interpretation and Reduction, Second Edition, 1972, Report UAG-23), that occur outside the EEJ over low latitudes, and mid latitudes, are known to be produced by wind/wind-shear mechanism (Axford, 1963; Whitehead 1961; Abdu and Batista, 1977). The latter types of Es, contrary to the q-type, could often blanket echoes from the F-region. The l and f type that occur during day and night, respectively, will be denoted here as l/f type Es. The h-type Es develops around 180 km and descending, in sequential ionograms, to lower heights (see for example, MacDougall, 1978; Wilkinson et al., 1992) becomes denoted as c-type Es. We shall from here on consider them as h/c-type Es. We have carried out an extensive analysis on the hourly occurrence statistics separately of the different types of Es layers.
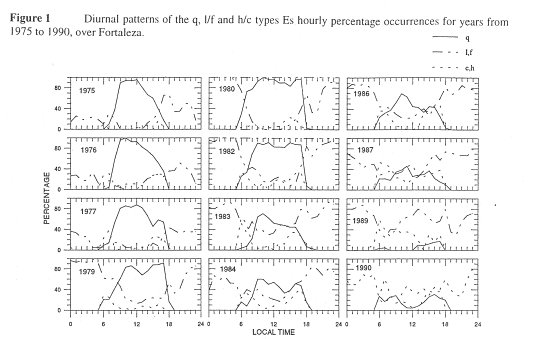
The hourly percentage occurrences during an year of the different types of Es layers with respect to the total number of soundings carried out during the year are plotted in Figure 1 as a function of local time. Results for the years, 1975-1977, 1979, 1980, 1982-1984, 1986, 1987, 1989 and 1990 are presented in this figure. The following features of this figure may be noted: 1)The q-type Es occurrence rises sharply after sunrise, reaches the highest rates approaching ~100% before noon and decays soon after midday to reach zero value around sunset. There is an afternoon enhancement in the Es occurrence in the years 1977, 1979-1980 and 1982. (2) The q-type Es occurrence rate starts a steady decline from 1982 (with ~90 percent) to 1989-90 (with 5-20 percent); (3) The h/c type events occur only during the sunlit hours, with maxima in morning and in evening hours. The amplitudes of these maxima show significant increase from 1975 (with ~15%) to 1990 (with up to ~60%). This diurnal double peak parameters is similar to the Es local time distribution pattern over Cachoeira Paulista reported earlier (Abdu and Batista, 1977). Their occurrence rates increasing from 1975 to 1990 shows a correspondingly increasing role of winds and wind shears in the Es layer formation over Fortaleza during this period. (4) The l/f-type Es that occurs generally in the 100-105 km region shows almost negligible daytime occurrence in 1975 and a steady increase to the order of 50 percent in 1990. This feature is in sharp contrast to the trend in the q-type Es occurrence which was exactly opposite during the same period.
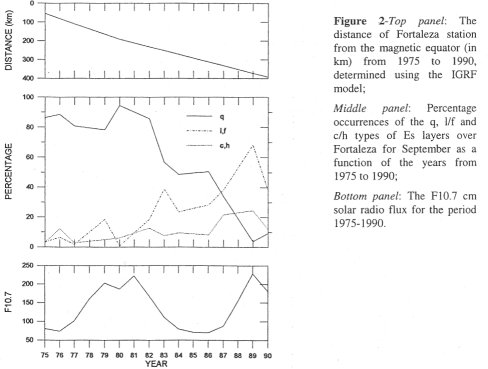
The Es occurrence rates averaged for the hours 10-14 LT are presented in Figure 2 (middle panel) together with the yearly average solar F10.7 flux (bottom panel) and the variation of the distance of the Fortaleza station from the magnetic equator as per the International Geomagnetic Reference Field (IGRF) model, as a function of years from 1975 to 1990. This figure permits us to analyse the long term changes in the different types of Es layers as a function of the increasing distance of the station from the center of the EEJ during the 16-year period, as well as in function of the solar activity cycle. We may note the following important parameters: (a) the q-type Es decreases from 90% occurrence in 1975 to almost insignificant values in 1990, as the EEJ drifted to further northward of Fortaleza. In other words the control of the EEJ associated E-field on the q-type Es layer formation decreased drastically from 1975 to almost negligible values in 1990. The other types of Es layers showed significant enhancement towards 1990, suggesting that their occurrences increased with increasing distance of Fortaleza from the EEJ center.(b) there are modulation cycles, superimposed over the long term trend, that are often in opposite phases in the q-type on the one hand and in the l/f and c/h types on the other. These modulations seem to be mainly produced by the solar activity cycle. For example, the broad maximum in the q-type Es centered around 1980 appears to coincide with the solar cycle maximum in the F10.7 cm flux. In contrast l/f and h/c types of Es showed maxima corresponding to the 1989 solar flux maximum
The long term trends in the occurrences of the different types of Es layers over Fortaleza are, in fact, manifestations of the variations, from the center to the periphery of the EEJ, of the competing roles of electric fields and neutral winds in the formation of these Es layers. At the EEJ center the vertical polarization Hall electric field driven by the primary E-layer dynamo electric field, is responsible for the gradient ExB drift (type II) irregularities that manifests as q-type Es in the ionograms. The Hall field gets weakened with increasing distance from the EEJ center. Thus the observed decrease in the q-type Es formation over Fortaleza from 1975 to 1990 can be attributed to the fact that during this period the Fortaleza station steadily receded from the EEJ center as shown in Fig. 2. On the other hand the l/f and c/h types of Es layers are known to be produced by winds that are expected to be the same in the rather restricted latitude range covered by the EEJ. At the periphery of the EEJ, that is, over Fortaleza towards the end of the analysis period, winds are very efficient in producing the l/f and h/c type Es. However, the formations of such wind induced layers seem to be opposed by the eastward electric field that is uniformly present in the EEJ and its periphery (nearby low latitude) regions. This can be verified from the fact that the decay of q-type Es occurrence that marks decrease of eastward electric field just before 18 LT is always accompanied by rapid rise in the wind induced Es layers, in Figure 1. Thus opposing influences of electric fields and winds are apparent in the formation of low latitude Es-layers. The increasing trend in the occurrences of l/f and h/c types of Es-layers from 1975 to 1990 seen in Figure 2 is, in fact, a net trend resulting from the opposing influence of an ambient eastward electric field in the formation of these layers by winds.
Abdu, M.A., and I.S. Batista, Sporadic E-layer phenomena in the Brazilian geomagnetic anomaly: evidence for a regular particle ionization source. J. Atmos. Terr. Phys., 39, 723, 1977.
Axford, W.I., The formation and vertical movements of dense ionized layers in the ionosphere due to neutral wind shears. J. Geophys. Res., 68, 769, 1963.
MacDougall, J.W., Seasonal variation of semidiurnal winds in the dynamo region, Planet. Space Sci., 26, 705, 1978.
Whitehead, J.D., The formation of the sporadic-E layer in the temperate zone, J. Atmos. Terr. Phys. 20, 49-58, 1961.
Wilkinson, P.J., E.P. Szuszczewicz, and R.G. Roble,
Measurements and modelling of intermediate descending and sporadic
layers in the lower ionosphere: results and implications from
global-scale ionospheric-thermospheric studies, Geophys. Res.
Lett., 19, 95, 1992.
Figure 1 Diurnal patterns of the q, l/f and h/c types Es hourly percentage occurrences for years from 1975 to 1990, over Fortaleza.
Figure 2-Top panel: The distance of Fortaleza station from the magnetic equator (in km) from 1975 to 1990, determined using the IGRF model;
Middle panel: Percentage occurrences of the q, l/f and c/h types of Es layers over Fortaleza for September as a function of the years from 1975 to 1990;
Bottom panel: The F10.7
cm solar radio flux for the period 1975-1990.
| Back to Bulletins index | Back to INAG-61 Contents page |